JSTime speaks the WebKit Inspector Protocol. For demonstration purposes, consider the following simple web server.Documentation Index
Fetch the complete documentation index at: https://docs.awfixer.me/llms.txt
Use this file to discover all available pages before exploring further.
--inspect
To enable debugging when running code with JSTime, use the --inspect flag. This automatically starts a WebSocket server on an available port that can be used to introspect the running JSTime process.
--inspect-brk
The --inspect-brk flag behaves identically to --inspect, except it automatically injects a breakpoint at the first line of the executed script. This is useful for debugging scripts that run quickly and exit immediately.
--inspect-wait
The --inspect-wait flag behaves identically to --inspect, except the code will not execute until a debugger has attached to the running process.
Setting a port or URL for the debugger
Regardless of which flag you use, you can optionally specify a port number, URL prefix, or both.Debuggers
Various debugging tools can connect to this server to provide an interactive debugging experience. JSTime hosts a web-based debugger at debug.jstime.sh. It is a modified version of WebKit’s Web Inspector Interface, which will look familiar to Safari users.debug.jstime.sh
JSTime hosts a web-based debugger at debug.jstime.sh. It is a modified version of WebKit’s Web Inspector Interface, which will look familiar to Safari users.
Open the provided debug.jstime.sh URL in your browser to start a debugging session. From this interface, you’ll be able to view the source code of the running file, view and set breakpoints, and execute code with the built-in console.
3 to set a breakpoint on our console.log(req.url) statement.
http://localhost:3000 in your web browser. This will send an HTTP request to our localhost web server. It will seem like the page isn’t loading. Why? Because the program has paused execution at the breakpoint we set earlier.
Note how the UI has changed.
req variable.
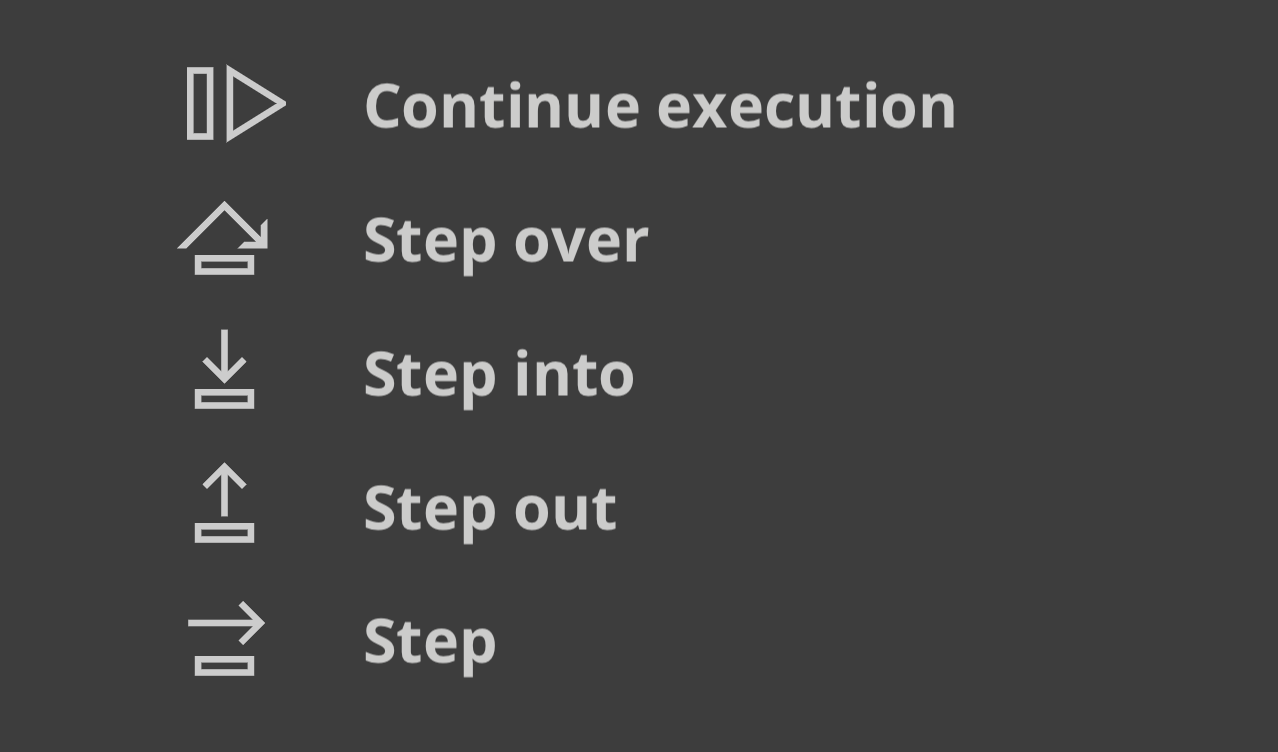
- Continue script execution — continue running the program until the next breakpoint or exception.
- Step over — The program will continue to the next line.
- Step into — If the current statement contains a function call, the debugger will “step into” the called function.
- Step out — If the current statement is a function call, the debugger will finish executing the call, then “step out” of the function to the location where it was called.